Purpose
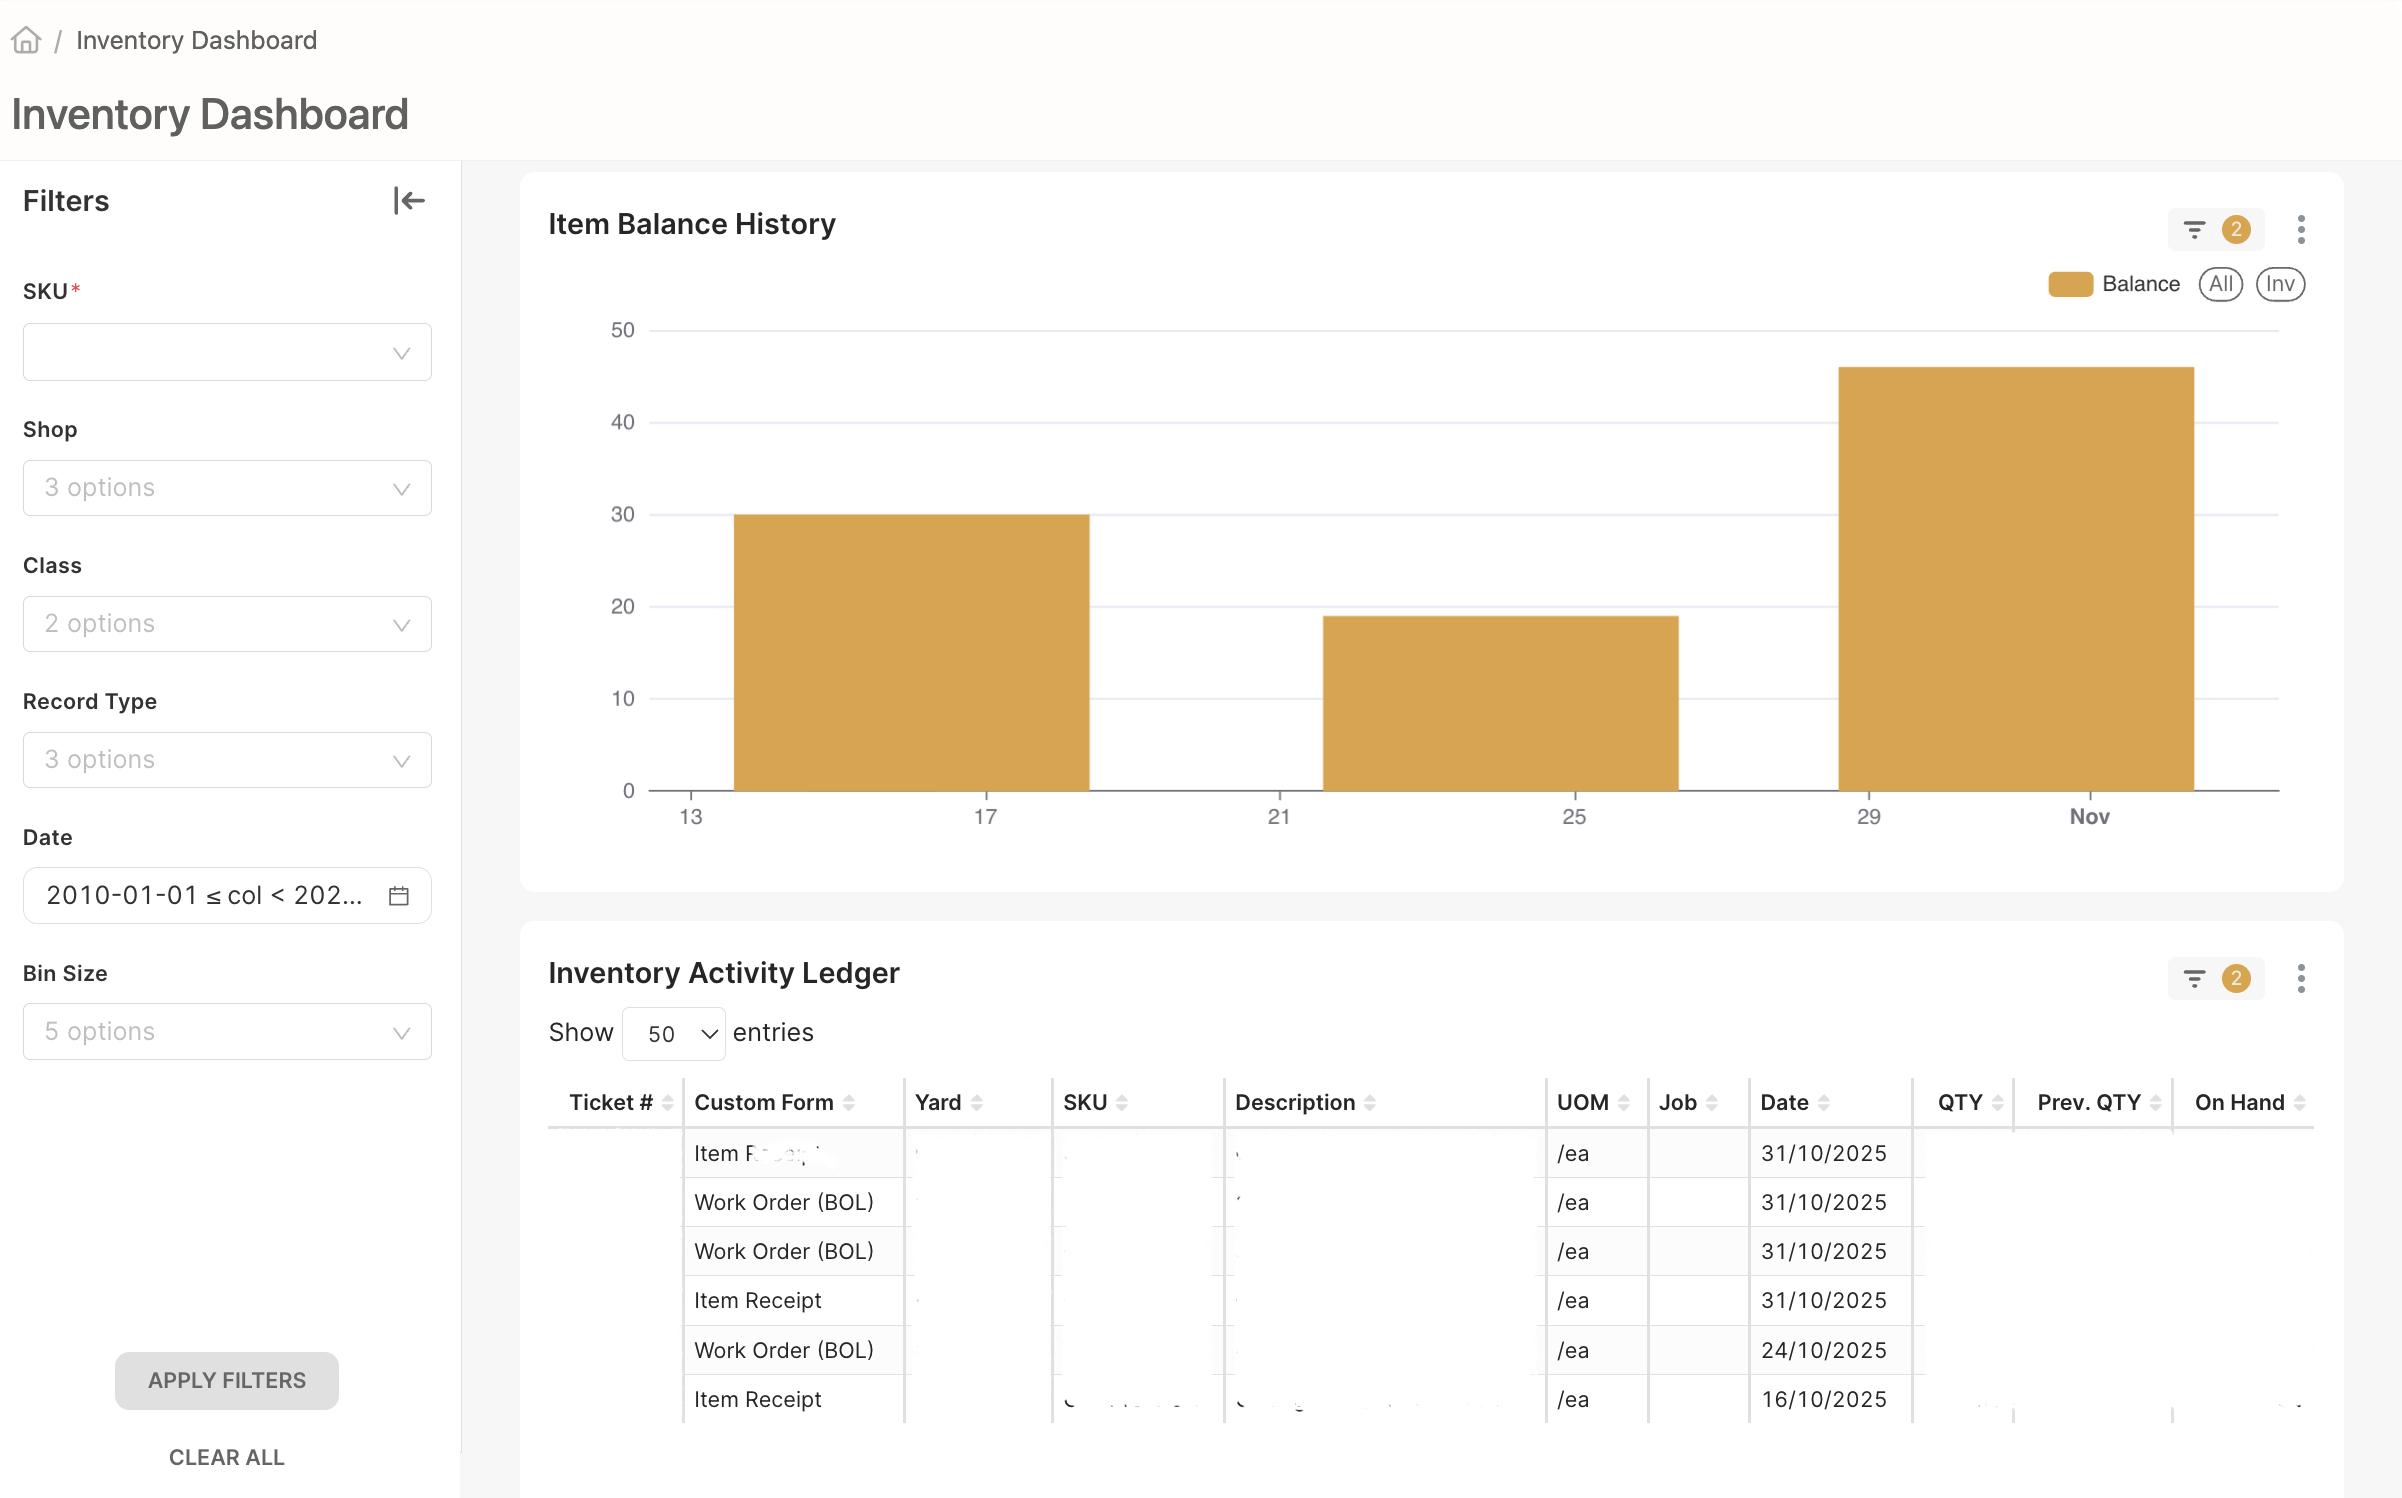
The new Inventory Dashboard helps warehouse managers easily see and track all items in the Shop and Warehouse. It shows what’s in stock, what’s been used, and how inventory changes over time — all in one place.
What’s New
1. Easy-to-Read Inventory Ledger
- See all your items, quantities, and last updates in one clear table.
- A new “On Order” column has been added (it will stay blank for now since we don’t use Purchase Orders yet).
- We removed some less-useful columns (Pre-Count and Designation) to keep things simple.
- Items are marked as:
- CONS (Consumables): deducted when used on a Work Order.
- COGS (Cost of Goods Sold): deducted only on Field, Tool, or Mixing Tickets.
2. Activity Ledger
- Shows all inventory movements — what was added, used, or adjusted.
- Helps you confirm why item counts changed and see the full history.
3. 12-Week Inventory Graph
- A line graph shows how your inventory levels change over the past 12 weeks.
- You can choose to view:
- One specific item, or
- All items together to see overall trends.
4. Filters and Search
- Quickly find the item or category you want to see.
- Optional dropdown lets you switch to the “Trailing 12-Week Graph” mode.
5. Clean and Simple Design
- Easier to read and use.
- Only the most important information is shown — no extra clutter.
Why It’s Helpful
- Better visibility: Always know what’s in stock and what’s being used.
- Faster tracking: Clear tables and graphs make it easy to find what you need.
- Smart planning: Weekly trends help you see when to restock or adjust usage.